Summary: Latitude vs. X
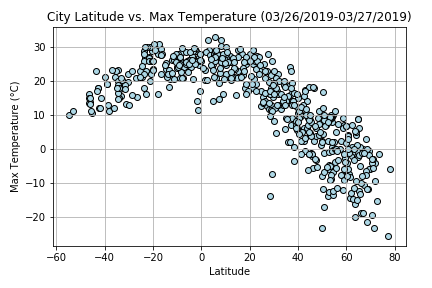
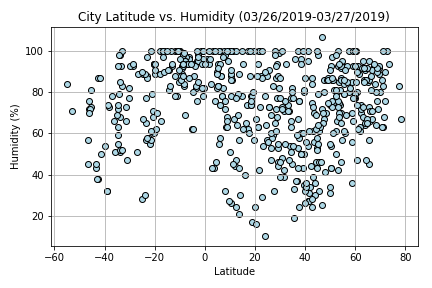
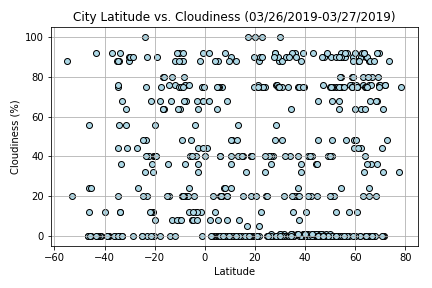
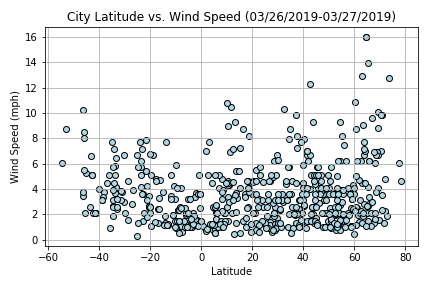
The purpose of the project was to analyze how weather changes as you get closer the equator. To accomplish this analysis, a list of 625 cities was randomly generated using citipy, then data was pulled from the OpenWeatherMap API to assemble a dataset with more than 500 cities.
After assembling the dataset, Pandas and Matplotlib were used to plot various aspects of the weather vs. latitude. Factors included were maximum temperature (°C), cloudiness(%), wind speed (meter/sec), and humidity (%). This site provides the source data and visualizations created as part of the analysis, as well as explanations and descriptions of any trends and correlations witnessed.
Visualizations